I can recognize several languages when I hear people speaking them (mostly because I lived in the Alexander International Dorm at NC State University). Therefore when I found a map of the most common languages spoken in each US state, it caught my attention, and I decided to try creating my own version of the map with a few improvements. It took a bit of clever SAS programming to grind through the 50 spreadsheets containing the data - perhaps you can learn some new tricks by seeing what I did!
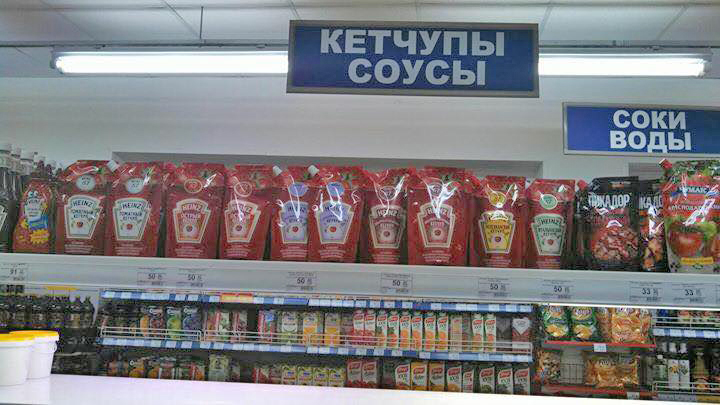
But before we get started, here's a little something to get you into an international mood. Can anyone identify the language in this picture sent in by my friend Kara? Is there a US state where this language is popular? And yes - Kara's a friend who lived in the Alexander dorm, back in my college days ... she's much younger than me though! ;-)
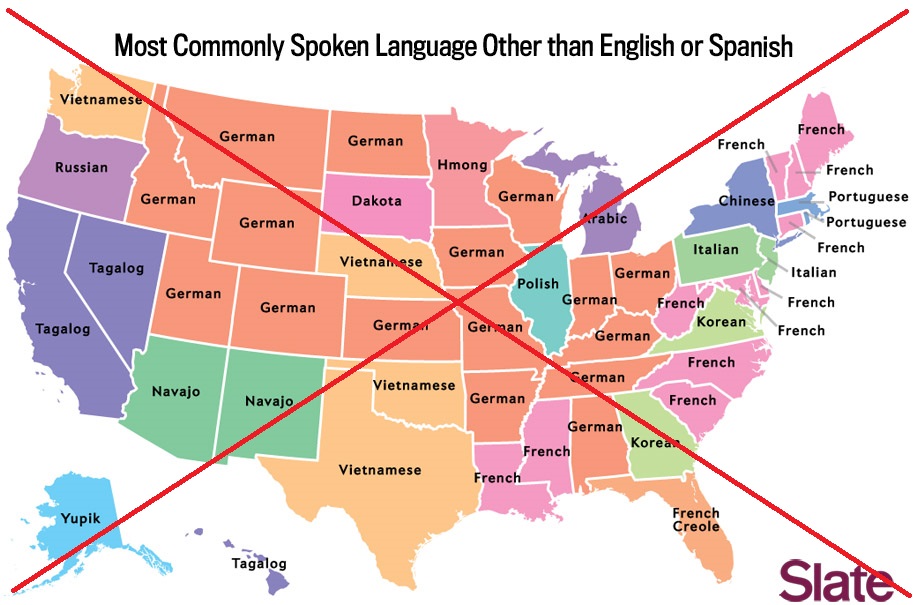
Here's the map I saw in an article on slate.com. It shows the most common languages spoken in each state other than English or Spanish. The article provides some details about the survey, and how the language question is presented, and is worth checking out. I was surprised to see so many different languages in the map!
My informal goal was to create a map exactly like the one above, but with mouse-over text added so you could also see the state names (since some people might not recognize all the states by their shape and location). I downloaded the Census spreadsheet that he linked to from his article, and after a bit of programming wizardry (see the 2nd half of this blog for details), I came up with the following map. Click it to see the interactive version with HTML mouse-over text:
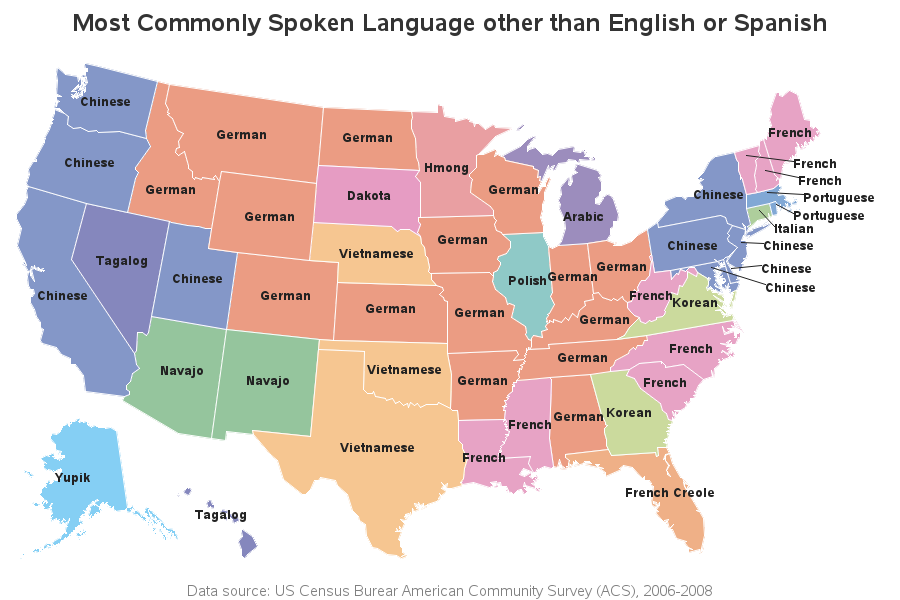
But I noticed that my map had more Chinese states than the original. For example, Pennsylvania was Chinese in my map, but Italian in the original map. Since something seemed to be wrong in my map, I decided to investigate.
The original article was written in May 13, 2014, so I wondered if the Census data link might be pointing to newer data now (2018). So I entered the data link into the Wayback Machine, and downloaded the snapshot of the spreadsheet from the most recent date before the article was written (March 29, 2014). That spreadsheet seemed to be the same as the current on, using 2006-2008 data.
Next I scrutinized the article for any mention of "Chinese" and found the following:
... an ACS participant does not select his language from a list of predeteremined options; he fills in a blank box with his self-selected answer. For instance, some people answered the ACS with “Chinese,” while others gave specific dialects such as “Mandarin” or “Cantonese”. These were all treated as different languages in the ACS data and when constructing these maps. New York is marked “Chinese” because more people responded with “Chinese” than any other language other than English or Spanish. If all Chinese languages (or languages under the umbrella of a larger language family) had been grouped together, the answers for many states would change.
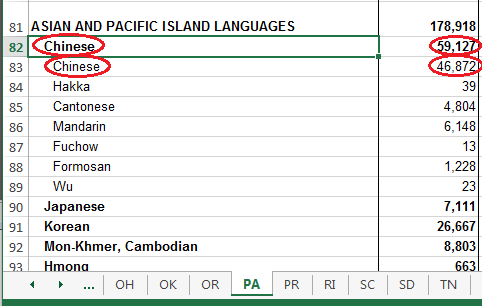
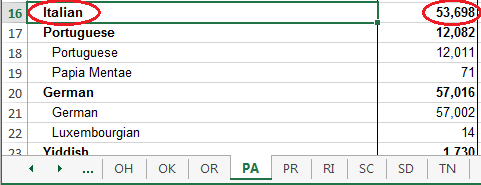
Mystery solved! If I just count the people who listed their language as 'Chinese' (excluding more specific dialects such as Cantonese and Mandarin) then the value for PA is 46,872, which is fewer than the 53,698 speaking Italian. But if you group all the Chinese dialects together, then you get 59,127 Chinese speakers ... which is more than the 53,698 Italian speakers.
For the way this map is being used, and the potential inconsistencies in data-entry (did someone who speaks Mandarin answer the ACS with Mandarin or Chinese?), I think it is best to group the dialects together. But I would be interested to hear a few language experts weigh in on this question - is it best to lump all the Chinese dialects together, or count them separately, for this map?
How'd he do that?...
The data for this map was in an Excel spreadsheet. How do you read those values into SAS, so you can plot them on a map? I used Proc Import with dbms=xls, (which will run on Windows, Linux, and Unix, as opposed to dbms=excel, which only runs on Windows). And I used the range= option to specify which of the 50 state tabs/sheets to read from, and the range of cells. Here's the code to read in the data for North Carolina. Notice I let my range try to read down to row 1000, so I don't have to know exactly how many rows of data there are.
PROC IMPORT OUT=temp_data DATAFILE="detailed-lang-tables.xls" DBMS=XLS REPLACE;
RANGE="NC$A4:E1000";
GETNAMES=YES;
RUN;
And now, you just have to repeat that code for each of the 50 states, using brute force, and a lot of copy-n-paste. (ugh!)
Wow - that's a lot of repetition, and a lot of lines of code to maintain. Why don't we just loop through the 50 states, and use a single copy of the import code in a SAS macro instead. That way we only have to maintain one copy of the import code! The following code creates a dataset of the 50 state abbreviations, and then uses a data step to loop through them and execute the macro each time through (passing the state abbreviation as a parameter to the macro).
proc sql noprint;
create table states as select unique statecode
from mapsgfk.us_states_attr where statecode^='DC';
quit; run;
data _null_; set states;
call execute('%do_state('|| statecode ||');');
run;
What does this macro look like, you might be asking... Basically, all it does is run the Proc Import, and stuff the state abbreviation in as the spreadsheet tab/sheet name in the range= option. There's a little more to it that that, and if you'd like to see all the details, here's a link to the full code.
%macro do_state(st);
PROC IMPORT OUT=temp_data DATAFILE="detailed-lang-tables.xls" DBMS=XLS REPLACE;
RANGE="&st$A4:E1000";
GETNAMES=YES;
RUN;
%mend;
Now that you've learned this data-management trick, do you have any old SAS jobs you might can simplify or streamline? Feel free to share and discuss in a comment!

5 Comments
So you lived or live in NC, a state with a large immigrant population, surely you have first hand knowledge with some of the languages commonly spoken there? Or since they are the most "popular" languages they are largely spoken by English speakers from the USA who learned them as a sort of novelty or to communicate with whomever, as opposed to those who grew in or live in a household that spoke that language. If French Creole is counted separately (see Florida) given the later scenario, then why is the French language so common there? It was never a colony, and Illinois/Missouri French has only a few remaining speakers. And even if Pennsylvania Deutch is included with speakers of German, that still doesn't account for all the states that are mostly German speaking. Most German speakers arrived well over a century ago!
Once we eliminate English and Spanish, I suspect the numbers get really small really quickly. Therefore we're looking at the biggest of the small numbers. :)
Folks interested in language data in the US might check out this site: https://asiasociety.org/mapping-nation/map.
And, yes, that is Russian. Note that all the words are plural, so it's Ketchups, Sauces, Juices, and Waters.
Thanks for your article! I was guessing the language in the image was Russian or a related language, so I used my Google Translate app to test my hypothesis. Russian translated perfectly--Ketchup Sauces and Juices/Water, so my guess is Russian... :)
And your guess is probably correct, sir! :)